

Inside MLVisor
Two ways to work, one autonomous engine — from raw data to a deployed model, powered by VisorEngine.
Full automation or full control
Write one sentence and let the engine build everything, or manage every parameter yourself. Both modes run on the same VisorEngine core.
Manual Mode
Users perform step-by-step data analysis and modeling using the platform's tools and controls with precision and full control.
Agent Mode
Users give natural-language instructions to the system to automate workflows. The system automatically selects appropriate algorithms and constructs models.
Learnable & Explainable
Monitor parameter changes in real time, explore mathematical foundations interactively, and follow the learning process through visual animations.
How It Works
From raw data to actionable insights in 4 simple steps
Connect Data
Upload your files or connect directly to your databases and APIs securely.
Smart Analysis
Our AI engine automatically cleans, processes and analyzes your data for patterns.
Visualize
Convert complex results into beautiful, interactive and easy-to-understand charts.
Share Results
Export reports or share dashboards with your team and stakeholders instantly.
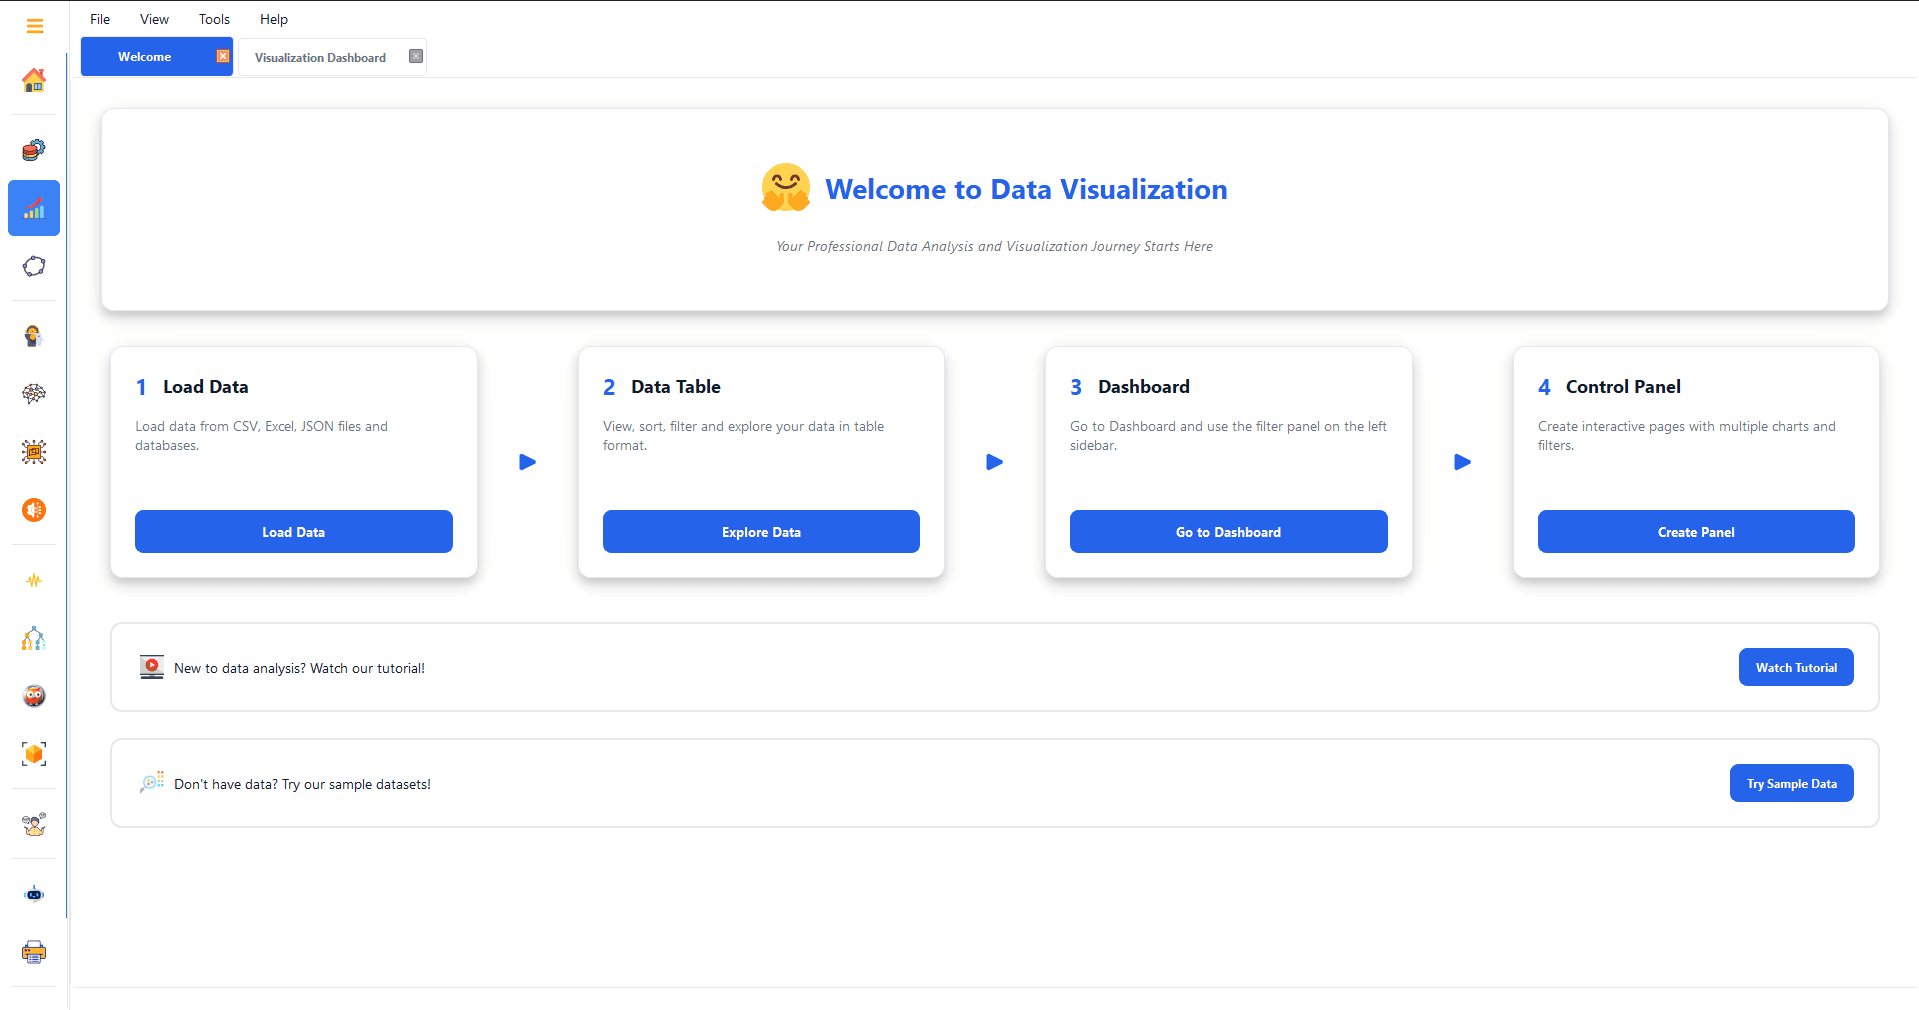
Data Visualization
Bring your data to life with powerful and interactive charts
20+ Chart Types
Display your data most effectively with a wide range of charts from line graphs to heat maps, scatter plots to 3D charts.
- Line and Area Charts
- Bar and Column Charts
- Pie and Donut Charts
- Heat Maps
- 3D Visualizations
- Waypoints Diagrams
Machine Learning
Predict the future with AI-powered analysis tools
AutoML
Create machine learning models without coding. Our system selects and optimizes the most suitable algorithm for you.
Prediction Models
Powerful regression and time series analysis tools to predict future trends and values.
Clustering Analysis
Group your data into meaningful clusters with K-means, hierarchical clustering and DBSCAN algorithms.
Data Processing
Clean, transform and prepare your data
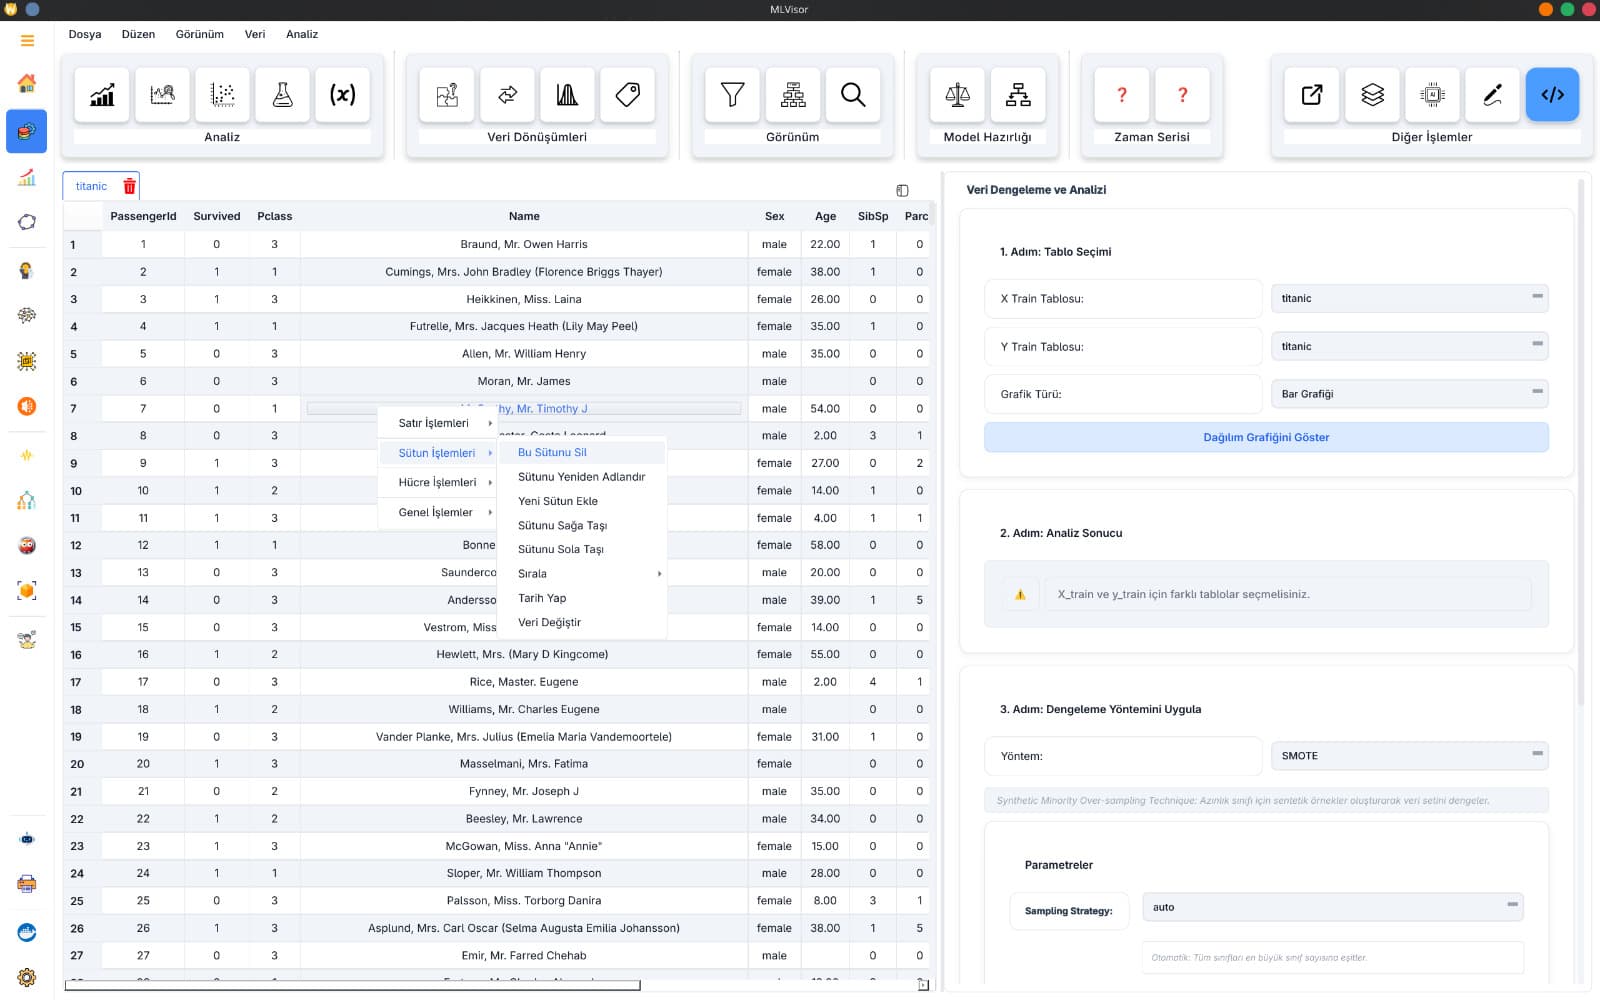
Smart Data Cleaning
Automatically detect and fill missing values. Identify outliers and normalize data.
- Automatic Data Cleaning
- Advanced Filtering
- Data Transformation
- Normalization
- Pivot Tables
- Data Merging
Collaboration and Sharing
Work with your team and share your results
Team Work
Share projects with your team, add comments and work together in real-time.
Easy Sharing
Share your analyses and visualizations with one click. Export in PDF, PNG, Excel formats.
Presentation Mode
Display your analysis results in professional presentations. Create interactive dashboards.
Integrations
Seamless integration with your existing workflow
Multiple Data Source Support
Connect to any data source from databases to Excel files, from APIs to cloud services.
- SQL Databases
- Excel and CSV Files
- Google Sheets, Dropbox
- REST APIs
- MongoDB, Elasticsearch
- Google Analytics, Salesforce
Advanced AI Models
Discover the intelligence behind MLVisor's predictions
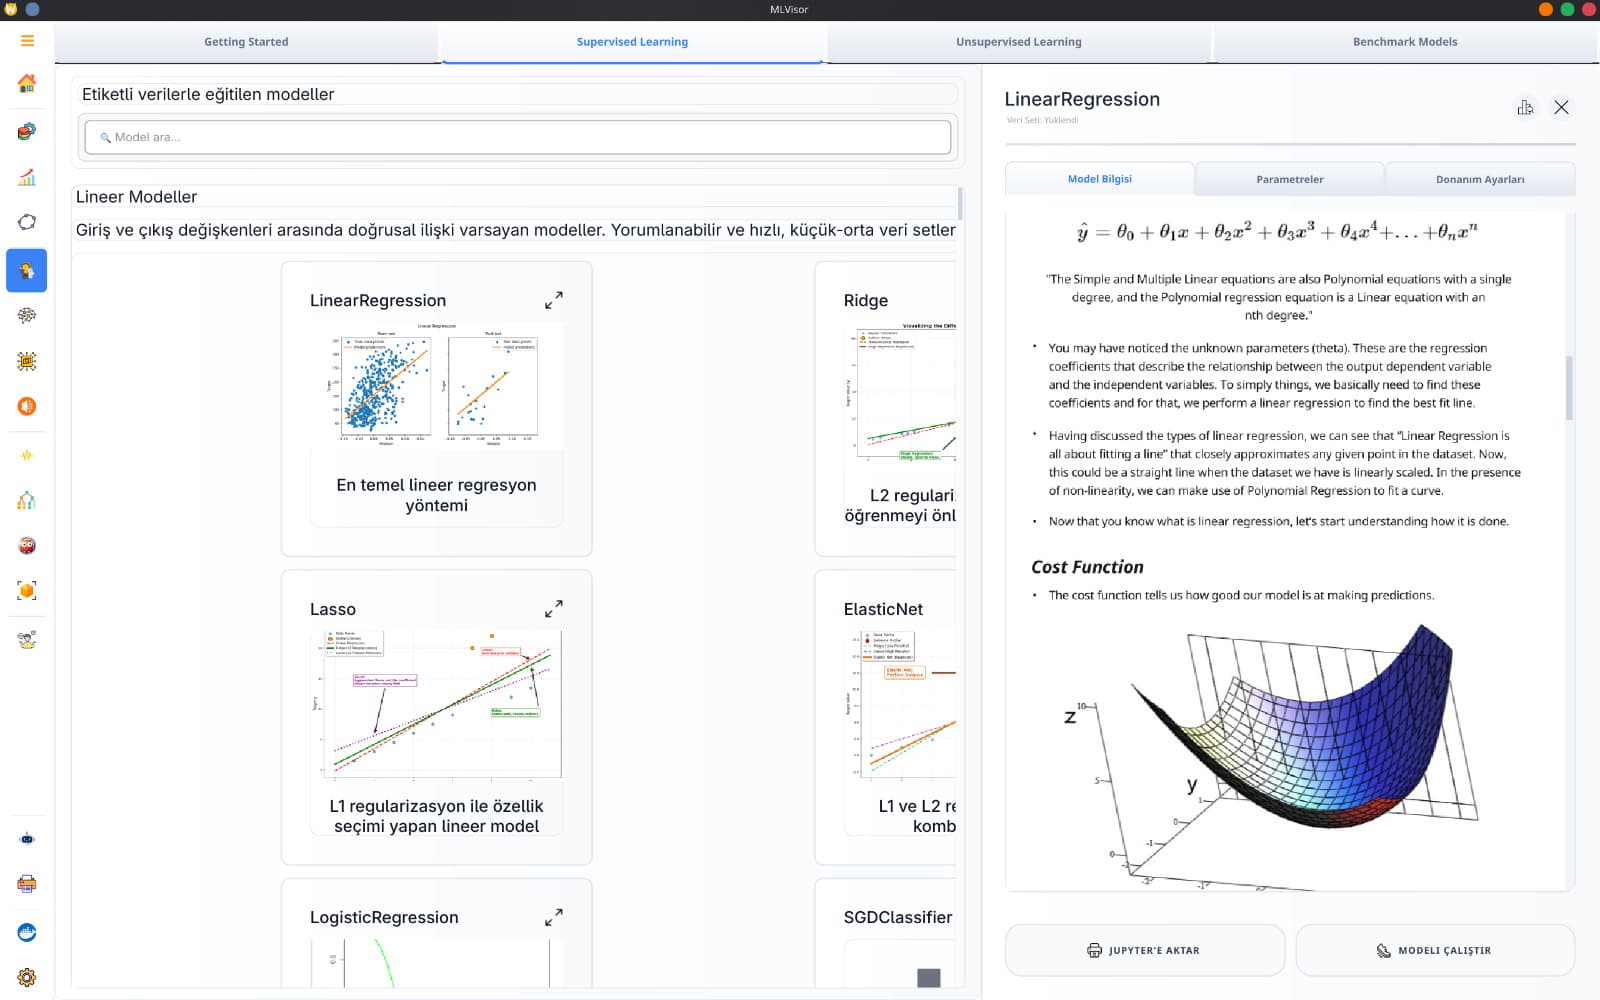
Discover Deep Learning
Learn more about the models running on our platform. Understand how our advanced AI algorithms process complex datasets to deliver precise, actionable insights.
- State-of-the-Art Architecture
- Neural Waypoints Insights
- Optimized Performance
- High Accuracy Tracking
Where your data runs
MLVisor is deployed into your environment. These three things follow from that, and they are the reason the architecture was built this way.
No external model in the loop
VisorEngine is our own inference engine. It does not wrap someone else's LLM and makes no calls to a third-party inference API.
Runs where your data lives
Your own hardware, your private cloud, or an isolated network. Datasets stay in your storage and processing happens on your compute.
You own the model weights
Trained models are produced inside your deployment and stay there. They do not leave your cluster without your explicit consent.